pacman::p_load(tidyverse, ggExtra, ggiraph)7 Scatterplot with Marginal Distribution
7.1 Learning Outcome
exam_data <- read_csv("data/Exam_data.csv")A simple scatterplot
p <- ggplot(data=exam_data,
            aes(x= MATHS, y=ENGLISH)) +
  geom_point() +
  coord_cartesian(xlim=c(0,100),
                  ylim=c(0,100))
p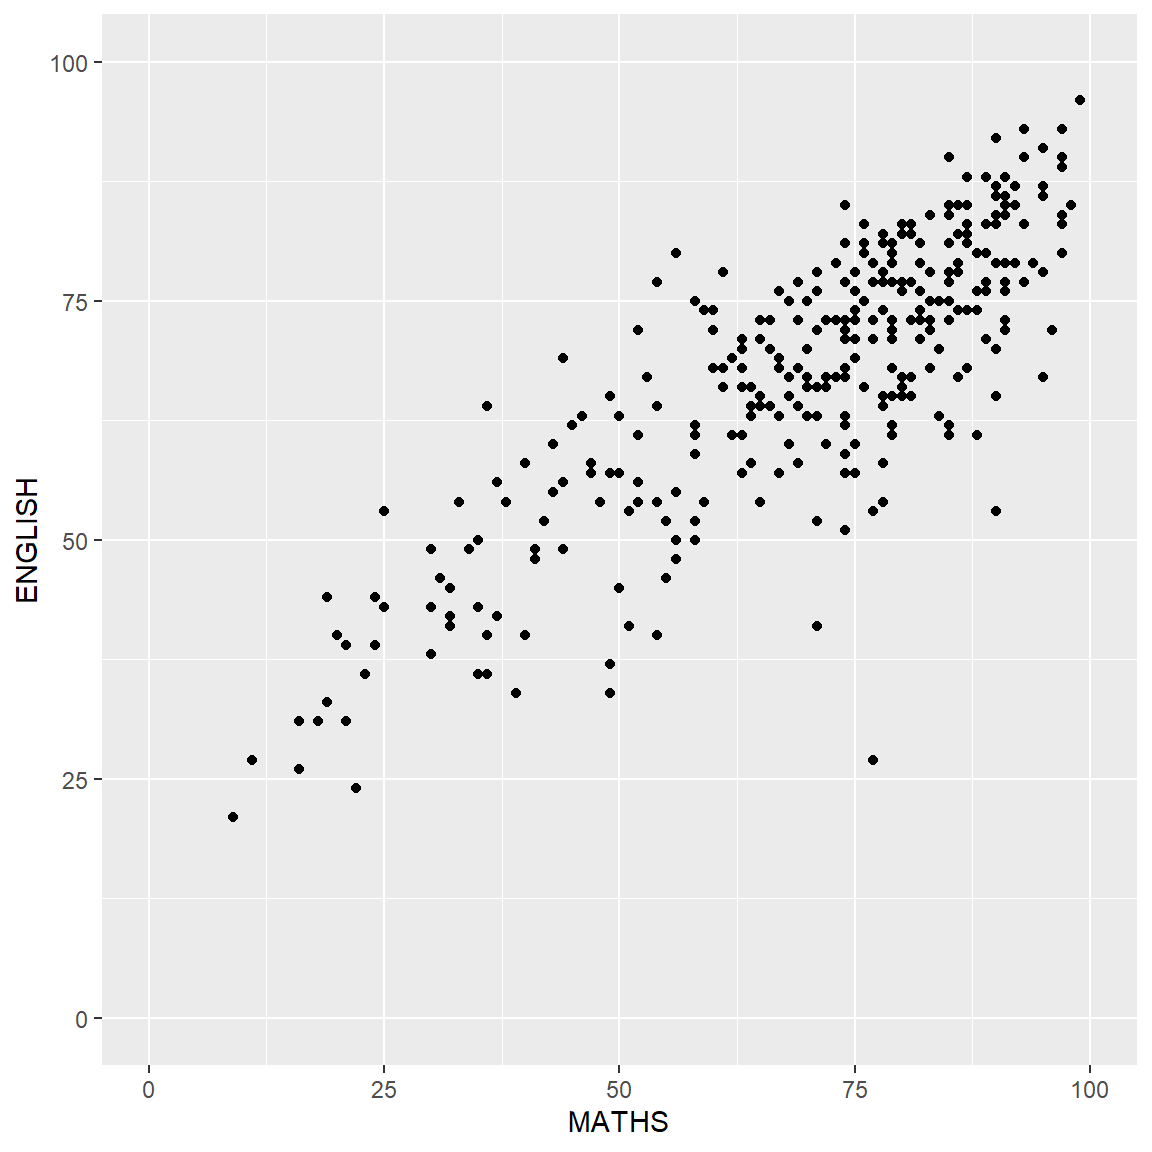
7.1.1 Plot Marginal Density Function
ggMarginal(p, type = "histogram",
           col = "grey45",
           fill = "grey90")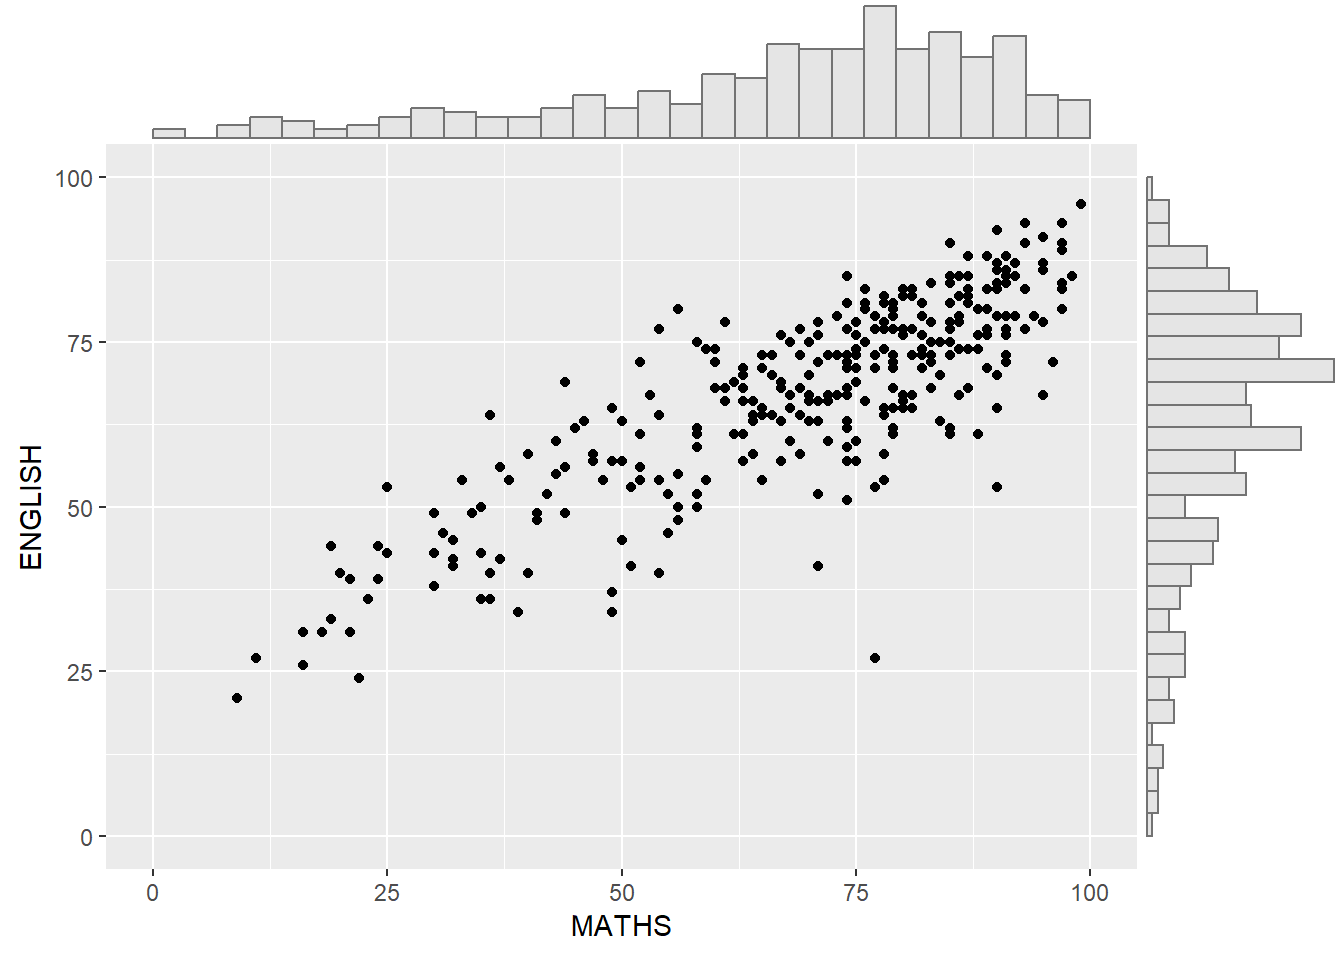
ggMarginal(p, type = "boxplot",
           col = "grey45",
           fill = "grey90")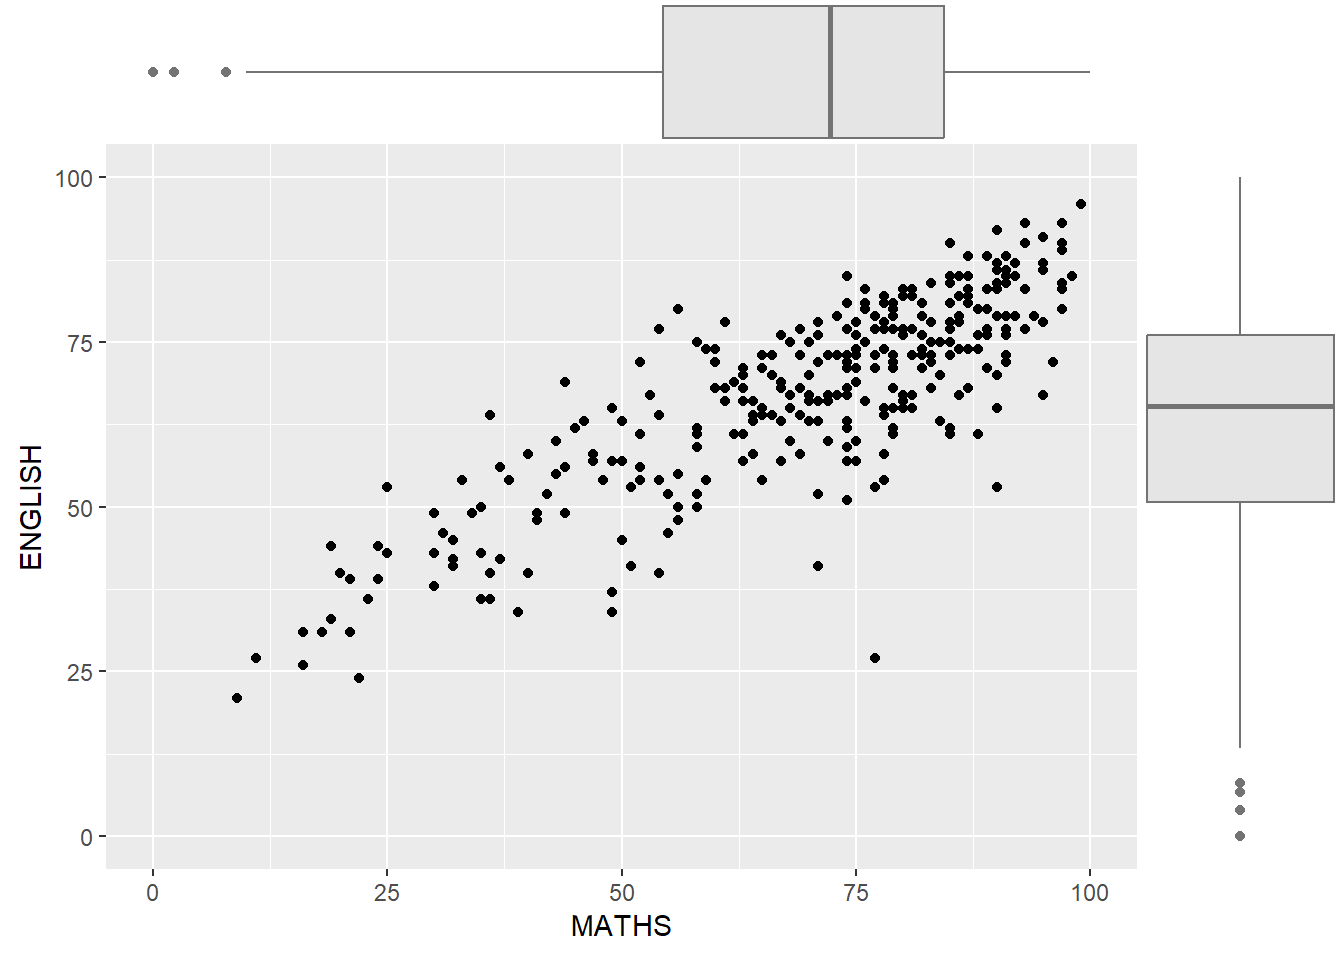
p2 <- ggplot(data=exam_data,
            aes(x= MATHS,
                y=ENGLISH,
                color=GENDER)) +
  geom_point() +
  coord_cartesian(xlim=c(0,100),
                  ylim=c(0,100))
p2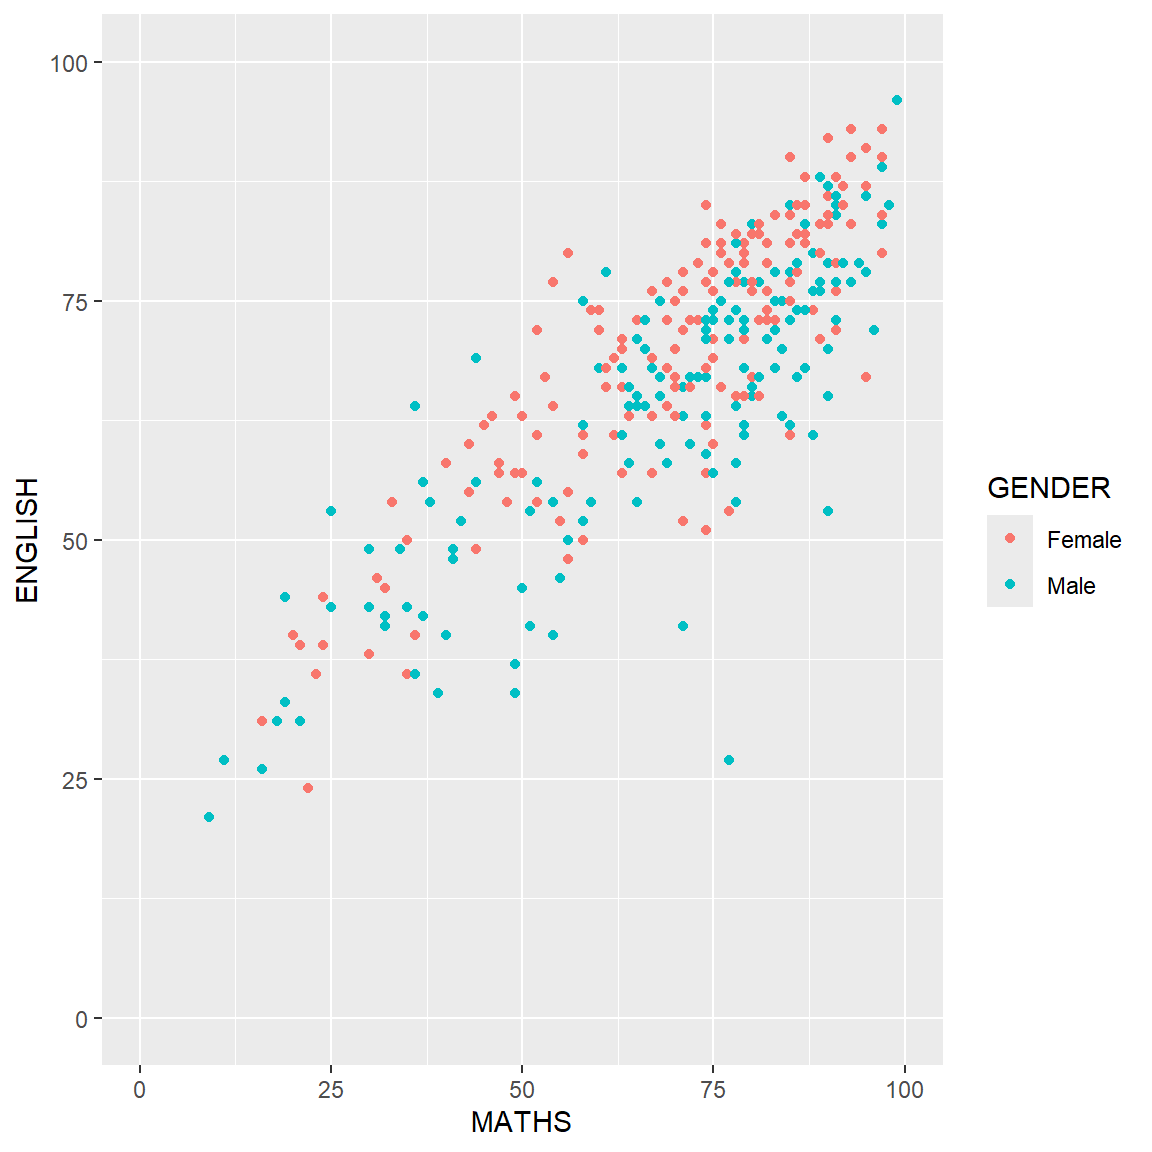
ggMarginal(p2, type = "boxplot",
           groupColour = TRUE,
           groupFill = TRUE)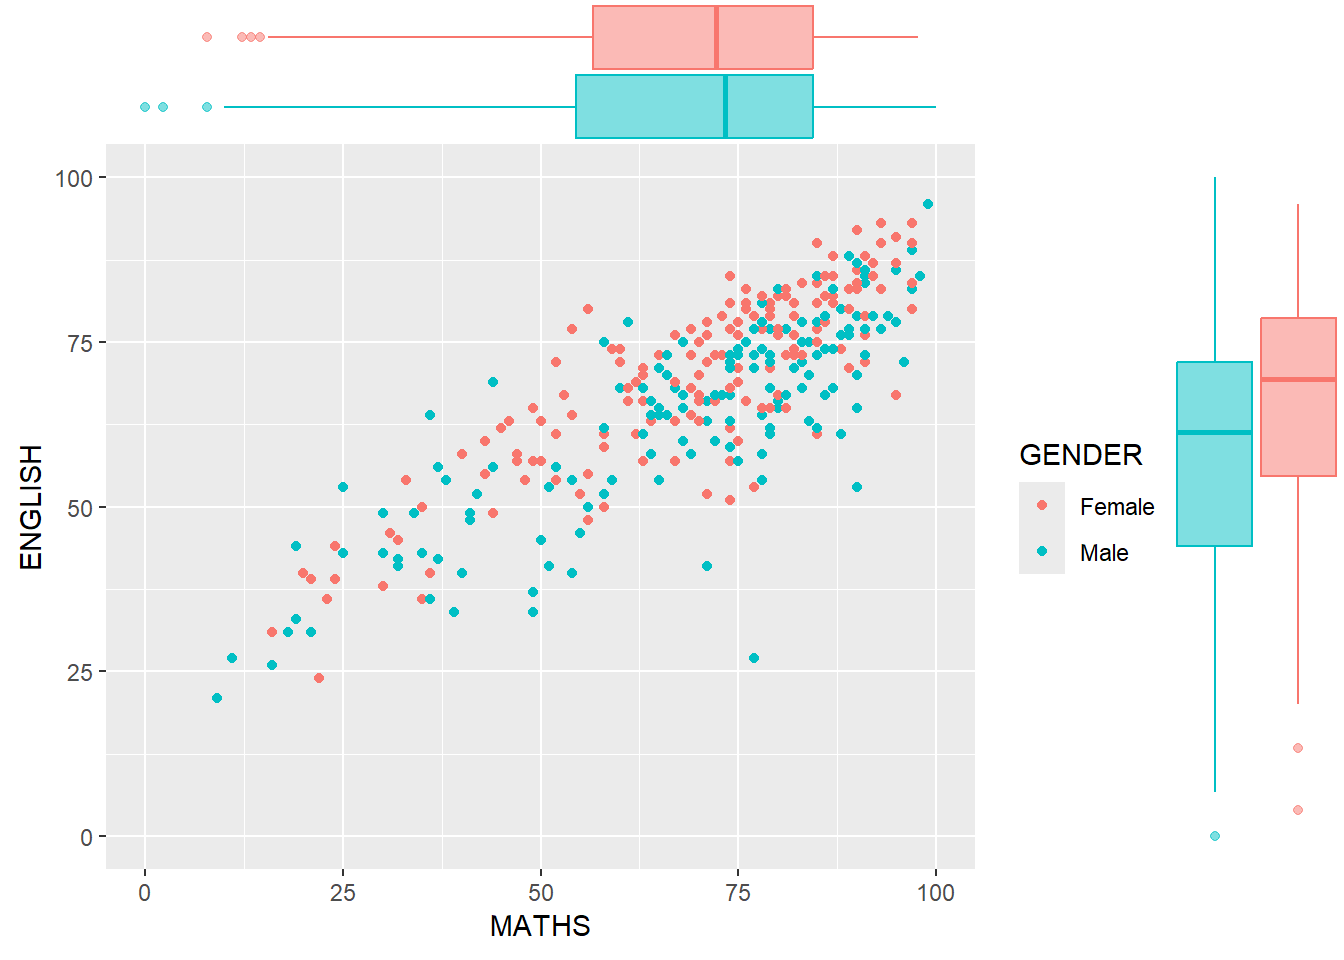
p3 <- ggplot(data=exam_data,
            aes(x= MATHS,
                y=ENGLISH,
                color=GENDER)) +
  geom_point() +
  coord_cartesian(xlim=c(0,100),
                  ylim=c(0,100)) +
  theme_bw() +
  theme(legend.position = "bottom")
p3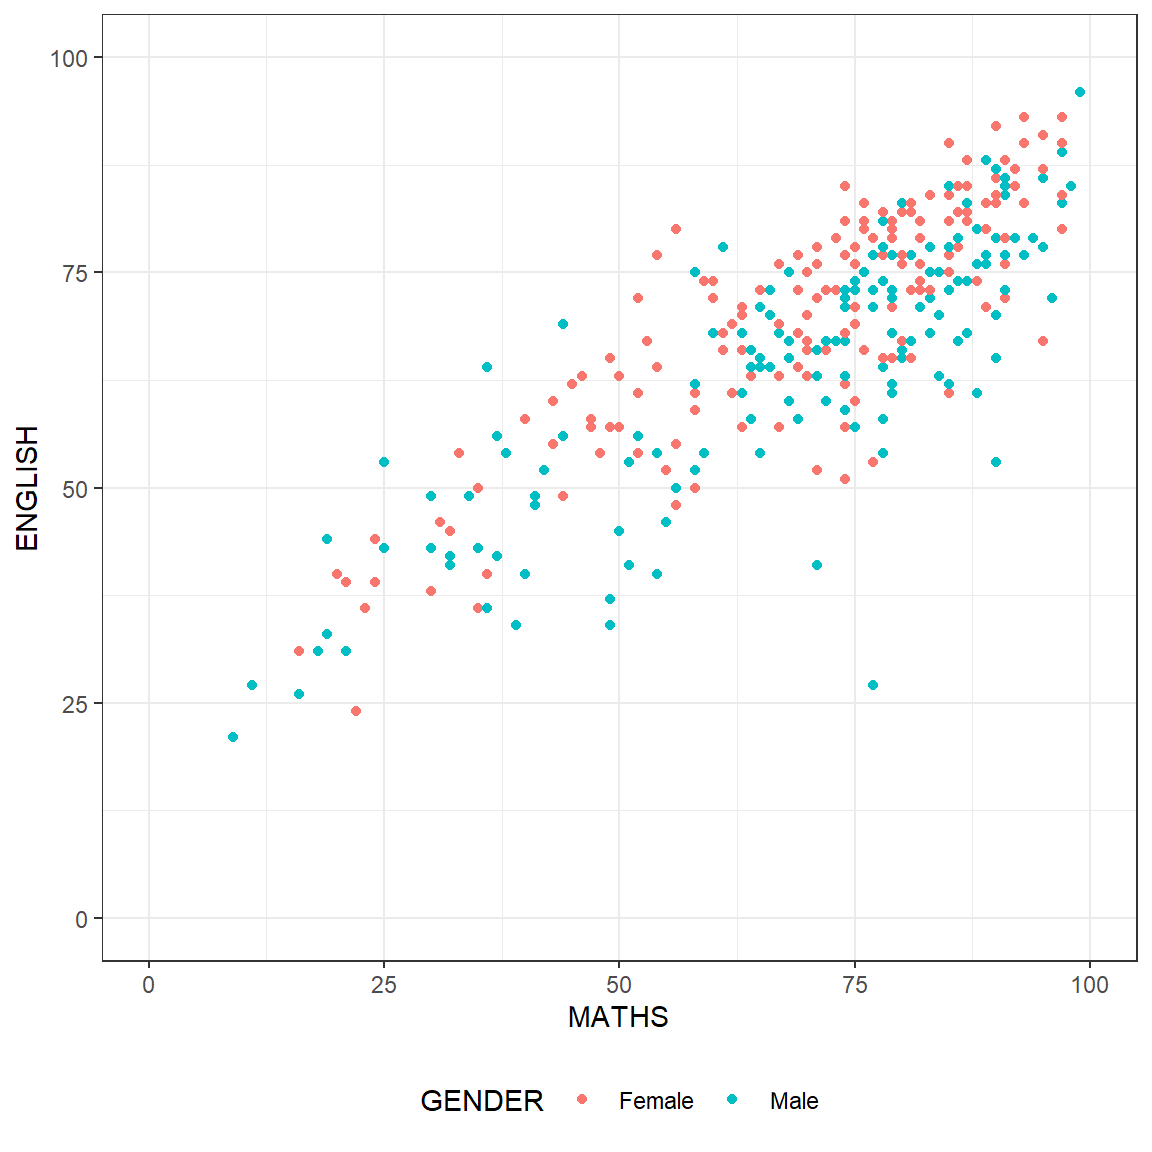
p4 <-ggMarginal(p3, type = "boxplot",
           groupColour = TRUE,
           groupFill = TRUE)
p3 <- ggplot(data=exam_data,
aes(x= MATHS,
y=ENGLISH,
color=GENDER)) +
geom_point_interactive(
aes(tooltip = ID,
data_id = ID),
size = 1,
hover_nearest = TRUE)
coord_cartesian(xlim=c(0,100),
ylim=c(0,100))<ggproto object: Class CoordCartesian, Coord, gg>
aspect: function
backtransform_range: function
clip: on
default: FALSE
distance: function
expand: TRUE
is_free: function
is_linear: function
labels: function
limits: list
modify_scales: function
range: function
render_axis_h: function
render_axis_v: function
render_bg: function
render_fg: function
setup_data: function
setup_layout: function
setup_panel_guides: function
setup_panel_params: function
setup_params: function
train_panel_guides: function
transform: function
super: <ggproto object: Class CoordCartesian, Coord, gg>girafe(ggobj = p3)